Grading, also known as Sieve Analysis or Particle Size Distribution, determines the proportion of particle sizes in a granular material (for instance soil or aggregates). Two methods are used for particle size distribution namely dry sieving and wet sieving. Wet sieving is a more accurate procedure for determining the particle size distribution of soils as most soil particles are cohesive, that is, the particles tend to bind together among themselves. As per BS 1377, the smallest sieve size used in the laboratory is 0.063mm. Therefore, grading of particles smaller than 0.063mm is normally determined by the Sedimentation Method, also known as the Hydrometer method. The Hydrometer method uses a dispersant solution and hydrometer to measure particle sizes in a soil suspension (colloid) by correlating the decreasing density of suspension and settling time intervals. Combined sieving and sedimentation procedures enable a continuous particle size distribution curve
of a soil to be plotted from the size of the coarsest particles down to the clay size.
The particle size distribution test is considered as a classification test for soil. This is because the test presents the relative portions of different sizes of particles. From the test results, it is possible to determine whether the soil consists of predominantly gravel, sand, silt or clay sizes, and, to a limited extent, which of these size ranges is likely to control the engineering properties of the soil.
Test Procedure – According to BS 1377
- Break lumps in the dry soil with mallet (without crushing particles).
- Mix the soil thoroughly and subdivide it to obtain a test sample.
- Determine the weight of test sample and record it (M1).
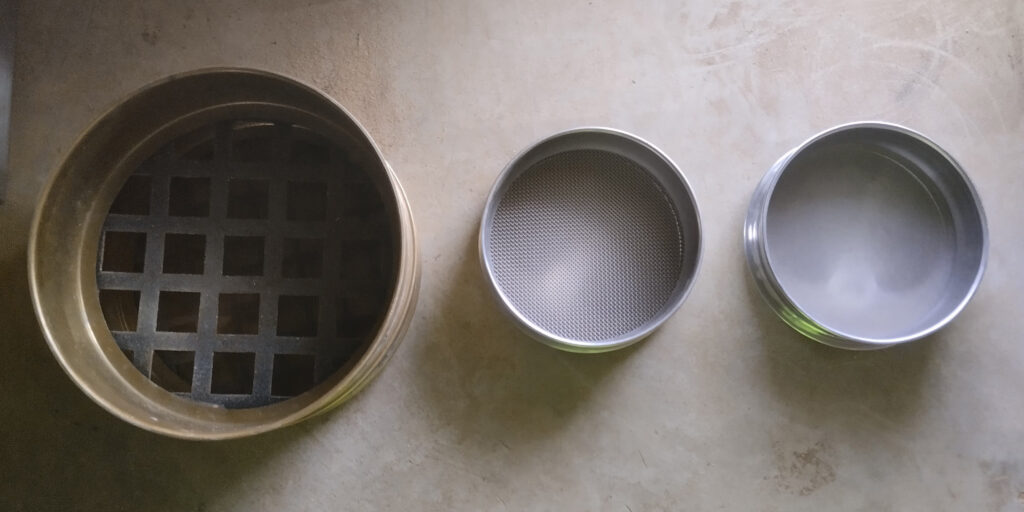
- Arrange sieves in sequence (order of their sizes). Test sieves have the following aperture sizes: 75mm, 63mm, 50mm, 37.5mm, 28mm, 20mm, 14mm, 10mm, 6.3mm, 5 mm, 3.35mm, 2 mm, 1.18mm, 600μm, 425μm, 300μm, 212μm, 150μm and 63μm.

- Pass the sample on a 20mm sieve and brush the larger particles to remove fines.
- Sieve particles retained on 20mm sieve on the larger sieves (e.g 75mm, 63mm, 50mm, 37.5mm and 28mm) and record the cumulative weight retained on each sieve (M2)
- Wash the particles passing 20mm sieve (a little at a time) on 1.18mm or 2.36mm sieve, nested on top of 0.075mm sieve.
- Dry the washed material in oven to a constant weight.
- Sieve it on 14mm downward to 0.075mm sieve and record the cumulative weight retained on each sieve (also as M2)
Grading Calculations
- Percentage retained on each sieve:
%retained = 
- Percentage passing on each sieve:
%passing= 100 – % retained (cumulative)
- Grading Modulus (GM) :
GM = 
- Coefficient of Uniformity (
 /
/ ):
):
 =
= 
- Coefficient of Gradation/Curvature:
 =
= 
Using a combination of the Co-efficient of Uniformity () and the Co-efficient of Gradation/Curvature (), mathematically, one can tell whether the soil sample is well graded or not. If is greater than 4 then the soil is well-graded gravel whereas if is greater than 6 then the soil is well-graded sand. However, one can’t rely on a single parameter alone to classify the soil, as this can be misleading, for instance, in case the soil is gap-graded, that is, it is missing a significant portion of soil particles of a certain size, the use of the Co-efficient of Uniformity alone can be misleading. The Coefficient of gradation is introduced to address this shortcoming. This coefficient of gradation describes the general shape of the curve. For well-graded soil, the value of must lie between 1 and 3.
The Grading Modulus (GM), also known as the Fineness Modulus, is used to assess the coarseness or fineness of a soil sample. A higher GM indicates a coarse soil sample with larger particles whereas a low GM indicates a fine soil sample with smaller particles. For well-graded soils, the GM should be above 1. A GM of approximately 1 suggests that the soil has a more uniform distribution of particle sizes. Uniformly graded soils might have a narrower range of particle sizes, which can sometimes lead to less stability and compactability compared to well-graded soils. A GM of less than 1 indicates poorly graded soils with a less desirable particle size distribution.
| Parameter | Value | Interpretation |
| Co-efficient of Uniformity () | >4 for gravel OR >6 for sand | Well graded. |
| Co-efficient of Gradation/Curvature () | Between 1 and 3 | Well graded. |
| Grading Modulues (GM) | >1 | Well graded. |
Presentation of Results and Interpretation
The percentage passing through the sieves are normally plotted on a graph as y-axis and sieve size as x-axis (in a log-scale) to produce the grading curve, which is used to classify soil materials in accordance to it’s particle sizes, as shown in the table below:
| Particle Size | Classification |
| Below 0.002mm (2 μm) | Clay |
| Between 0.002mm (2 μm) and 0.063 (63 μm) | Silt |
| Between 0.063mm (63 μm) and 2mm | Sand |
| Between 2mm and 63mm | Gravel |
| Between 63mm and 200mm | Cobbles |
| Above 200mm | Boulders |
Sand and gravel particles can further be subdivided into fine, medium and coarse particles as shown below:
| Soil Type | Classification | Particle Size |
| Sand | Fine Sand | 0.063 mm (63 μm) to 0.25 mm (250 μm) |
| Medium Sand | 0.25 mm (250 μm) to 0.5 mm (500 μm) | |
| Coarse Sand | 0.25 mm (250 μm) to 0.5 mm (500 μm) | |
| Gravel | Fine Gravel | 2 mm to 4 mm |
| Medium Gravel | 4 mm to 8 mm | |
| Coarse Gravel | 8 mm to 63 mm |
An example of a grading curve is as shown below:


A quick look at the general shape, position and slope of the gradation curve indicates the type and gradation of the soil. A smooth S-curve is produced for well-graded soil. A well-graded soil should have a wide range of particle sizes present. If for instance, the soil only contains large particles, the curve will be offset to the right and vice-versa for smaller particles. If the soil sample lacks some particles of a certain dimension, this will be presented as a horizontal line.
Data Entry Form
Click below to download the data Entry Forms for Grading:
Significance of Grading in Engineering Applications
Soil grading is crucial in various engineering applications. It is an indicator of engineering properties such as compressibility, that is, the soil’s ability to be compacted effectively. Furthermore, soil grading also gives an indication of the soil’s shear strength and hydraulic conductivity.
Generally,a poorly graded soil will have better drainage characteristics as opposed to well-graded soils as it has more voids in its structure.
When building embankments and other earthworks, say in a road project, it is a requirement that the gradation of the fill material is determined. In this case, a well-graded soil is preferred as it is easier to compact hence leading to a stronger structure.


