The California Bearing Ratio (CBR) test is an essential soil test used to evaluate the strength and load-bearing capacity of soil materials. The essence of the CBR test is to compare the penetration resistance of a soil material to that of a standard rock material, expressed as a percentage. As the name suggests, the test was developed in California, United States, in 1928 by the California Division of Highways, now the California Department of Transportation, or Caltrans. The CBR test quickly gained popularity due to its simplicity and effectiveness. The CBR test, despite having some shortcomings in terms of not taking into consideration some fundamental properties that have great influence on the soil performance , is still the popular method for evaluating the strength of subgrade soil and pavement materials. Indeed, the CBR value forms an integral part of several flexible pavement design methods, including the Kenya Road Design Manual Part III.
CBR Test Specifications
Similar to the proctor compaction test discussed earlier, the CBR of a soil sample can be determined using the British Standards (BS) or the American Association of State Highway and Transportation Officials (AASHTO). Similarly, 2.5 kg and 4.5 kg rammers are used for light compaction and heavy compaction respectively, under the following conditions:
British Standard BS 1377-4:1990
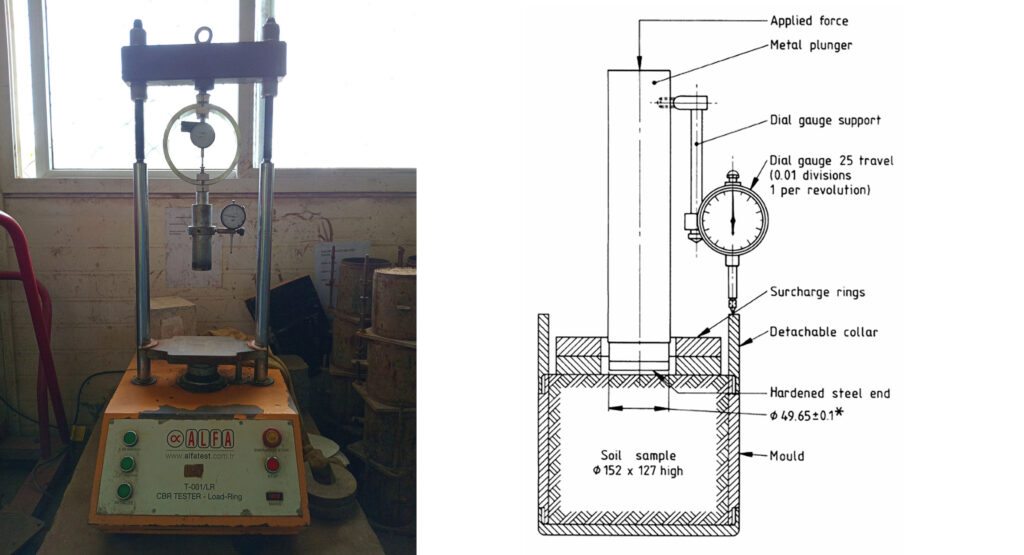
Mould Size : 152mm dia by 127mm high (volume = 2305 cm3)
Specimen 1: 2.5kg rammer, 3 layers, 62 blows per layer,
Specimen 2: 4.5kg rammer, 5 layers, 30 blows per layer,
Specimen 3: 4.5kg rammer, 5 layers, 62 blows per layer.
Static Compaction*: 1 specimen, 3 layers, 1 minute per layer.
*In static compaction, a uniform pressure is applied gradually to compress the soil in a mould. The pressure is usually applied using a hydraulic press or other compression equipment. Dynamic compaction on the other hand, involves the compaction of a soil sample by repeatedly dropping a hammer or rammer onto the soil sample in a mould. In this article we are going to concentrate on dynamic compaction, as referred earlier under the proctor test.
American Association of State Highway and Transportation Officials (AASHTO) – T 193
Mould size: 152.4mm dia. x 116.4mm** high (volume = 2124 cm3).
Using 2.5kg Rammer:
Specimen 1: 3 layers, 10 blows per layer,
Specimen 2: 3 layers, 30 blows per layer,
Specimen 3: 3 layers, 65 blows per layer.
Using 4.5kg Rammer:
Specimen 1: 5 layers, 10 blows per layer,
Specimen 2: 5 layers, 30 blows per layer,
Specimen 3: 5 layers, 65 blows per layer.
**Alternatively, a 177.8mm mould might be used with a spacer disk 61.3mm high to obtain a thickness of compacted specimen that conforms to the thickness: 116.4mm of specimens in proctor compaction (T99 & T180)
General Procedure
a) Dynamic Compaction
- Carry out Proctor test to determine the maximum dry density (MDD) at optimum moisture content (OMC).
- Prepare about 6kg of air-dried soil passing 20mm sieve for each of the CBR specimen (normally a set of three specimens is made).
- Determine the natural moisture content (NMC) of the dry soil before adding water.
- Calculate the amount of water to be added to the soil to get the optimum moisture content (OMC) as follows:

Where:
OMC – Optimum Moisture Content (obtained previously using proctor test)
NMC – Natural moisture content of the sample
m – Weight of the sample
- Weigh the mould with its perforated base plate and record its mass (M1).
- Put the soil in a tray and add amount of water calculated in step 4.
- Mix the sample thoroughly and take a small portion for moisture content.
- Place the mould on a hard surface and fix the collar.
- Place the layers according to the specified method (BS or AASHTO) and compact each layer using the proper rammer.
- Distribute blows uniformly over the surface of each layer (the last layer should not project over the mould by more than 6mm).
- Remove the collar, trim excess soil over the mould and take the weight of the mould with the base plate and soil (M2).
- Remove the base plate and put filter paper on it; invert the specimen and tie the base plates back on the moulds.
- Put perforated swell plate on the specimen, add surcharge weights*** and put the specimen in a curing tank. Ensure that there is free flow of water around the specimen (a mesh platform at the bottom of the soaking tank ensures this)
- Place the swell gauge on the specimen; record the initial reading (R1) then add water to approximately 5mm below the top of the collar and leave the specimen in water for 4 days.

***NOTE: One surcharge disc of 2 kg simulates the effect of approximately 70 mm of superimposed construction on the formation being tested. However, the exact amount of surcharge is not critical. Surcharge discs of any convenient multiples may be used.
Calculations


b) CBR Penetration
- After 4 days, place swell gauge on each specimen and record the final readings (R2).
- Remove the specimens from water, allow them to drain for 15 minutes and then penetrate each one.
- Record the dial gauge reading at each penetration interval (as shown in test sheet).
- Use the ring factor to convert the gauge readings into force (KN).
Calculations


c) CBR Results
Record the value obtained at the penetration of 2.5mm and 5.0mm, and report the higher value as the CBR of the material.
NOTE : The British Standard specifies CBR value at 2.5mm and requires the test to be re-run if the value at 5.0mm is greater thatn the one at 2.5mm.
Report the swell value obtained at heavy compaction (i.e. swell obtained at the mould compacted with highest number of blows using 4.5kg rammer).
Presentation of Results and Interpretation
To determine the CBR of the material whose sample was tested, follow the following steps:
- Plot a graph of the Loading in (KN) against the penetration of plunger as shown in the attached worksheet. If using the AASHTO procedure, you will plot a total of 6 curves – 2 for 10 blows (top and bottom), 2 for 30 blows (top and bottom), and 2 for 62 blows (top and bottom).
- Using the ring factor, determine the CBR at 2.5m and 5mm as described in the formula above – under calculations.
- Next plot the Dry Densities against CBR as shown in the worksheet attached. Wth this graph, you can extrapolate any level of compaction to the respective CBR, for instance, if you would like to determine the CBR of the material at 93% MDD, knowing the MDD obtained from Proctor Compaction Test, drectly read off the CBR value corresponsing to that Dry Density from the curve.
- A plot of the swell against the CBR also assists in the determination of the expected swell at any given CBR, as shown in the attached worksheet.
CBR Shortcomings
Some of the limitations associated with the CBR test include:
- Empirical Nature – The CBR test is empirical, meaning it is based on observed relationships rather than fundamental soil mechanics principles. This limits its applicability outside the conditions for which it was originally developed.
- Soil Type Sensitivity – The CBR test is less accurate for certain soil types, particularly fine-grained soils like clays, which may exhibit swelling or shrinkage when subjected to changes in moisture content. The test may also be less reliable for very soft or organic soils. Additionally, the test may give erroneous results in case the soil sample contains large particles. For this reason, only a soil sample passing the 20mm sieve is used (read more on particle size distribution here). In a case whereby the test sample contains a huge proportion of large particles, the gradation of the material is modified and only material passing the 20mm sieve is used. The material so modified, however, might have significantly different strength properties than the original material.
- Moisture Content Dependence – The CBR value can vary significantly with changes in moisture content. Soils that are not tested at their in-situ moisture conditions may yield misleading results, as the test typically involves soaking the sample, which may not represent actual field conditions.
- Time-Consuming – The CBR test, particularly when the sample is soaked for several days, can be time-consuming. This can be a drawback in situations where quick decisions are needed.
- Overemphasis on Penetration Resistance – The CBR test primarily measures the penetration resistance of soil, which may not fully capture all aspects of soil behavior under load. It doesn’t directly account for other important factors like soil stiffness, permeability, or long-term settlement behavior.
- Equipment Sensitivity – The accuracy of the CBR test relies on well-calibrated equipment. Any deviation or malfunction in the testing apparatus can lead to incorrect results.
- Not Applicable to all Construction Types – The CBR test is primarily useful for road and pavement design. It may not be applicable or relevant for other types of construction projects, such as foundations, where different soil properties are more critical.
Significance of CBR Test in Engineering Applications
The California Bearing Ratio (CBR) test remains one of the most widely used methods in geotechnical engineering for evaluating the strength of subgrade soils and base materials. Its significance lies not only in its simplicity and cost-effectiveness but also in the vital role it plays in pavement design and other earthwork-related construction activities.
1. Pavement Design
One of the primary applications of the CBR test is in the design of flexible pavements for roads, highways, airport runways, and parking lots. The CBR value directly influences the thickness of pavement layers. A higher CBR value indicates a stronger subgrade, which allows for thinner pavement layers, thus reducing material costs. Conversely, low CBR values highlight the need for soil improvement or thicker pavement layers to ensure structural integrity and longevity.
2. Subgrade Evaluation and Improvement
CBR testing helps engineers assess whether the in-situ soil can support expected traffic loads or if stabilization measures are necessary. It guides the selection of soil improvement techniques such as compaction, lime or cement stabilization, and the use of geosynthetics to increase bearing capacity.
3. Quality Control During Construction
In construction projects, CBR testing is frequently used to verify the strength of compacted fill layers or subgrade before placing the next layer. This quality control ensures that the materials used meet the specified performance criteria, preventing premature pavement failure and costly repairs.
4. Material Suitability Assessment
CBR results help determine the suitability of different materials for use in road construction. Gravel, crushed stone, and natural soils can be tested and classified based on their CBR values. This assessment is crucial for selecting cost-effective materials that meet engineering requirements.
5. Empirical Correlations in Design Standards
Many road authorities and design manuals, including AASHTO and BS standards, incorporate empirical relationships between CBR values and pavement layer thickness. These standardized design charts simplify the decision-making process and ensure uniformity in pavement design practices across different projects and regions.


