In soil mechanics and geotechnical engineering, understanding the behaviour of soil under varying moisture contents is crucial. Atterberg Limits are a series of tests used to determine the critical water content thresholds of fine-grained soils. Just like grading, atterberg tests are classification tests, as they help classify soils based on their consistency and are essential for designing and evaluating soil for construction projects.
Atterberg Limits determine the range of water contents at which soil changes from solid to plastic, referred to as the Plastic Limit, and from plastic to liquid states, referred to as the Liquid Limit. A Swedish chemist by the name of Albert Atterberg established these tests which were named after him. These tests would later be refined by Casagrande.
The Atterberg Limits are:
- The Plastic Limit (PL): The Plastic Limit is the minimum moisture content that changes a soil from solid (dry state) to a plastic (mouldable) state.
- Liquid Limit (LL): The Liquid Limit is the maximum water content at which a soil changes from a plastic state to a liquid state, that is, turning into mud.
- Plasticity Index (PI): The Plasticity Index is the range of moisture contents at which soils remain plastic (mouldable condition).
The Shrinkage Limit (SL), though not ideally considered as an Atterberg Limit, refers to the water content at which any further loss of moisture will not lead to any more reduction in volume of the material.
The chart below defines these Atterberg’s Limits clearly:

Test Procedures – According to BS 1377
Plastic Limit, PL
In the laboratory, the plastic limit of a soil sample is determined as the moisture content which allows a soil sample to be moulded into a thread that cracks when it’s diameter is about 3mm.
The test procedure for determining the Plastic Limit is as below:
- Sieve the air-dried soil sample on 0.425mm sieve to obtain about 300g, and take about 20g of the material for the test, reserve the remaining amount of sieved soil for Liquid Limit Test. (for more on sieve analysis of soil refer to our earlier post on grading)
- Place the sample (20g) on a glass plate and mix it thoroughly with distilled water using spatula (soaking for 24 hours is required for clayey soils).
- Mould a ball between the fingers, and then roll it between the palms of the hands until slight cracks appear on the surface.
- Form a thread of about 6mm between the first finger and the thumb.
- Roll the thread between tips of the fingers and the glass plate until it cracks (ensure the cracks appear when the thread is about 3mm)
- Collect the broken pieces of the thread into two containers, and determine the moisture content.
- Report the average moisture content (in whole number) as the Plastic Limit.
NOTE: In determining the Plastic Limit of the Soil Sample using the above procedure, we are ideally drying the sample through the heat on the hands as well as evaporation, as the soil sample looses moisture and dries, it reaches the plastic limit at which point it starts cracking.
Liquid Limit, LL
In the laboratory, the Liquid Limit of a soil sample is determined as the moisture content that makes a groove close with 25 blows of the Casagrande apparatus, or the moisture content that allows a cone to penetrate 20mm in a soil sample in 5 seconds.
Casagrande Method
- Take about 200g of material passing through 0.425mm sieve.
- Place a sample on the glass plate and mix thoroughly with distilled water using a spatula (soaking for 24 hours is required for clayey soils).
- Place a portion of the mixed sample in Casagrande apparatus and level it parallel with the base of the apparatus.
- Cut a groove along the diameter through the centre of the hinge.
NOTE: With soils having low plasticity indices it is sometimes difficult to cut a smooth groove in the soil with the grooving tool. However, it does not necessarily follow that because a smooth groove cannot be obtained, the soil is non-plastic, and it should be recorded that the liquid limit could not be obtained by this method. The cone penetrometer method is the only practicable procedure for soils of this type.
- Turn the handle at a rate of 2 revolutions per second until two sides comes into contact (along a length of 13mm) and record the number of blows that closed the groove.
NOTE: Some soils tend to slide on the surface of the cup instead of flow taking place within the soil. If this occurs the result should be discarded and the test repeated until flowing does occur. If, after additional increments of water, sliding still occurs, the test is not applicable and a note should be made that the liquid limit could not be obtained by this method.
- Take a small portion of the material for moisture content.
- Remove the soil from the apparatus, add little water, mix thoroughly and repeat step (3) to (6) at least four times.
- Plot the moisture content on the y-axis and number of blows on x-axis on a semi-logarithmic chart and join the points by a straight line (best-fit line).
- Interpolate the moisture content corresponding with 25 blows and report it as the Liquid Limit.

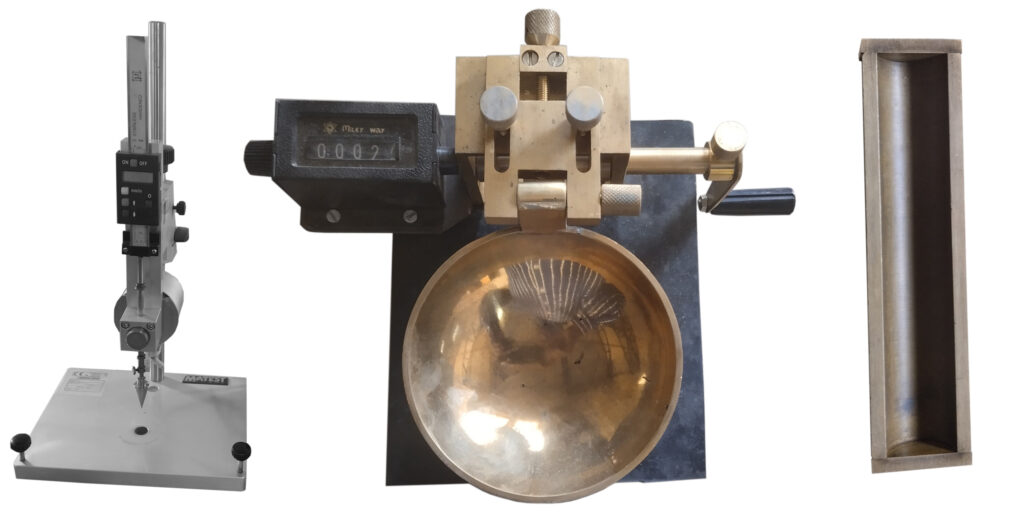
Penetrometer Method
- Sieve air-dried soil on 0.425mm sieve and take about 200g of the material passing the sieve.
- Place sample on a glass plate and mix it thoroughly with distilled water using spatula (soaking for 24 hours is required for clayey samples).
- Place a portion of the mixed sample in the soil cup, taking care not to trap air. Strike off excess soil with the straightedge to give a smooth level surface.
- Place the cup under the cone and lower the cone until it just touches the surface of the soil; then record the dial gauge reading.
- Release the cone for 5 seconds and then lock it in position.
- Lower dial gauge to touch the cone and record the reading.
- Lift the cone up, remove some soil from the cup and add more soil from the mixing glass.
- Place the cup under the cone, penetrate it again (repeat this step three times) and record the average of the three readings.
- Take a small portion of the material from the cup for moisture content.
- Lift the cone up, remove the soil, add little water, mix thoroughly and repeat step (3) to (8) at least four times by adding little water in the same sample.
- Plot cone penetration on y-axis and moisture content on x-axis on linear scale and join the points by a straight line.
- Interpolate the moisture content corresponding with the penetration of 20mm and report it as the Liquid Limit.
NOTE: The Penetrometer Method of determining the Liquid Limit of a soil sample has been proven to be more reliable than the Casagrande Method. This is because the Penetrometer Method is basically a static test depending on soil shear strength. Additionally, the Penetrometer Method is easier to carry out and is capable of giving more reproducible results. The Casagrande Method, on the other hand, introduces alot of dynamic effects to the procedure and is more susceptible to discrepancies, for instance between operators.

Plasticity Index, PI
The Plasticity Index is the range of moisture contents at which soils remain plastic (mouldable) as is clearly labeled in the Atterberg Limit Definitions diagram above. The Plasticity Index is determined arithmetically as the difference of the Liquid Limit and the Plastic Limit:

A higher PI indicates a higher clay content, meaning that the material can undergo significant deformation before becoming liquid. Such soils have high plasticity and are more likely to exhibit expansive behavior. Low PI indicates low plasticity, meaning the soil contains less clay and more silt or sand. These soils are less likely to swell or shrink significantly with moisture changes.
Other terms related to Plasticity Index are:


is the natural moisture content.
Linear Shrinkage, LS
Linear Shrinkage refers to the decrease in length of a wet soil sample after drying. The Linear Shrinkage simulates the volumetric changes that occurs as wet soil dries. Linear Shrinkage is determined using a Linear Shrinkage Mould whose image appears below :

The same factors that apply to Linear Shrinkage also apply to the converse condition of expansion due to wetting.
The test procedure for determining the Linear Shrinkage of a soil sample is as below:
- Clean the mould, measure the length (h1) and apply a thin film of grease at the inside walls.
- Take about 150g of the soil paste at Liquid Limit, fill it fully in the mould and tap it on a hard surface to remove air pockets.
- Level the mould using a flat edge and remove surplus soil around it.
- Allow specimen to dry in air for 24 hours, and then dry it in the oven.
- Allow the specimen to cool and measure its length (h2)

Apart from the Linear Shrinkage method for determining the shrinkage characteristics of soil, Volumeteric Shrinkage method can also be used. We shall not discuss Volumetric Shrinkage method in this article.
Presentation of Results and Interpretation
Liquid Limit
Penetrometer Method
To determine the Liquid Limit using the Penetrometer Method, plot the penetration in mm on y-axis against the moisture content on x-axis. From the line of best fit obtained in the graph, read off the moisture content at a penetration of 20mm as the Liquid Limit.
Casagrande Method
To determine the Liquid Limit using the Casagrande Method, plot the Moisture Content in y-axis against the number of blows on the x-axis (in logarithnic form). From the line of best fit obtained in the graph, read off the moisture content corresponding to 25 blows as the Liquid Limit.
Excel and PDF templates are attached below showing these workings clearly.
Significance of Atterberg Limits in Engineering Applications
The Atterberg Limits, encompassing the Liquid Limit (LL), Plastic Limit (PL), Plasticity Index (PI), and Linear Shrinkage, play a crucial role in understanding and predicting the behavior of soils in various engineering contexts. These laboratory tests provide essential data that influence the design and construction of infrastructure projects. The Liquid Limit helps in identifying the moisture content at which soil transitions from a plastic to a liquid state, which is vital for assessing the stability and suitability of soil for construction foundations. The Plastic Limit indicates the moisture level at which soil begins to exhibit plastic behavior, guiding the compaction and handling procedures in fieldwork. The Plasticity Index, derived from the difference between Liquid Limit and Plastic Limit, aids in classifying soils and predicting their potential for expansion and shrinkage, which is critical for designing pavements, embankments, and other earth structures. Linear Shrinkage measures the volume change of soil as it dries, offering insights into potential cracking and settlement issues. Collectively, these parameters enable engineers to make informed decisions, ensuring the durability and safety of construction projects by adapting designs to the specific properties of the soil at hand.
Click on the short video below demonstrating the laboratory test for atterberg limits for a better understanding:


satisfied